Medal Statistics in the Olympic Games: A case of power-laws?
Olympic games: A statistical analysis
Disparity of gold medals across countries
With the Paris 2024 Olympic Games recently concluded, it's a great time to take a closer look a the distribution of medals across countries from a statistical viewpoint - a question that I have been using as a homework exercise in my classes for many years.
One notable observation that immediately catches the eye is the huge gap in medal counts among countries. While a few nations dominate the medal tally, the majority manage to win only a handful or none at all. In the 2024 Summer Games, for instance, the USA and China each gained 40 gold medals, that is about 25% of the total number of gold medals awarded, while 114 countries didn't even win a single medal.
This disparity raises the question of whether these observations can be systematically analyzed using some basic statistics. To dig a bit deeper into these patterns, we will explore whether the medal distribution continues smoothly from the top-ranking countries down to the many countries with zero medals.
Right-skewed medal histogram
Since the number of medals won depends on a variety of factors, including luck and specific country and sport idiosyncrasies, it is beneficial to average data over multiple Olympic Games to derive more ‘universal’ insights.
Such information, specifically the all-time Olympic Games medal table, is available from the International Olympic Committee and is tabulated comprehensively on
Wikipedia.
Using this data, I created a histogram, showing how many countries have won a certain number of gold medals across all Olympic Games from 1896 to 2024, including both Summer and Winter Games (check out the Wikipedia page for all the details on how the data was compiled):
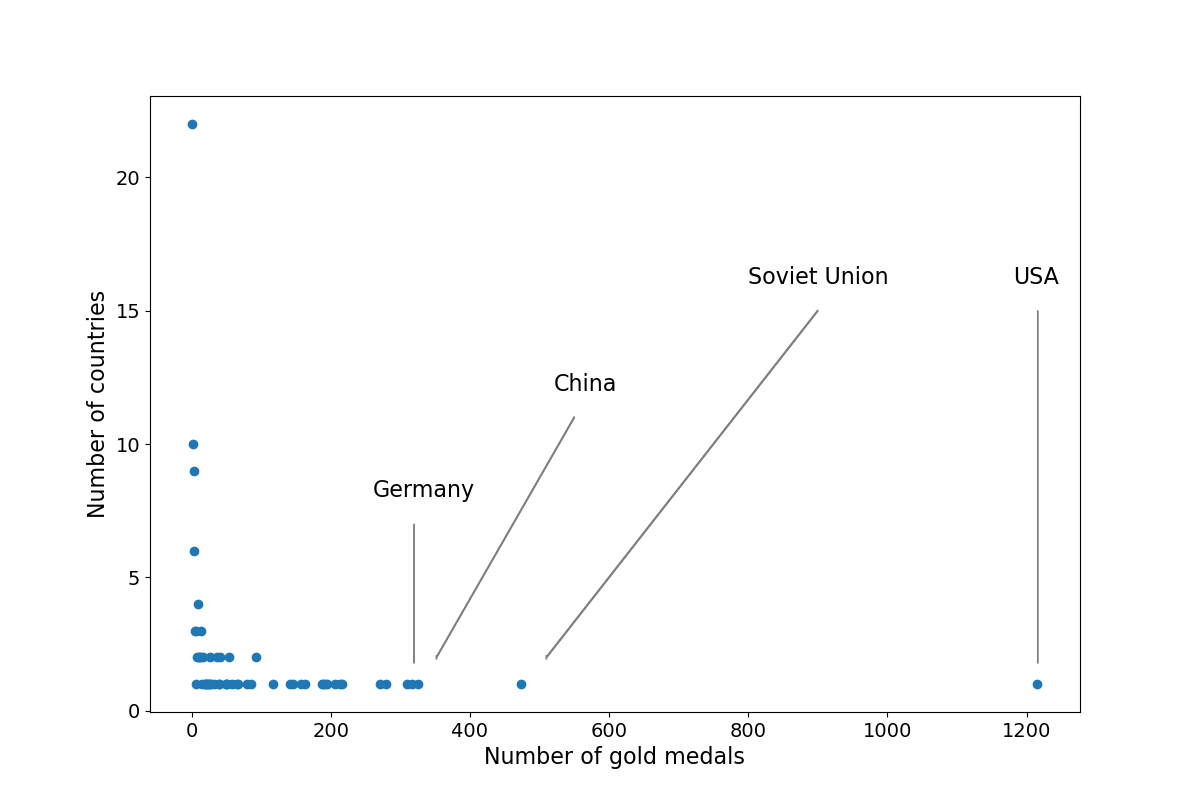
This histogram is highly right-skewed and reveals a very broad distribution of medals among countries. The USA leads with an impressive 1,215 gold medals, followed by the Soviet Union with 473, China with 325, and Germany with 317. In stark contrast, 22 countries have not won a single medal.
This confirms the observation from the 2024 Olympic Games of an enormous variability in medal gains, but it does not provide much insight into the decay of medals gains across countries. The histogram is just too broad to yield detailed information when plotted in this way.
Histogram with logarithmic binning reveals a power-law
With such broad, or ‘long-tailed’, distributions it is usually a good idea to plot the histogram with double-logarithmic axes. Doing this in a proper way involves some technical details, such as maintaining equally spaced bin positions. For more on these techniques, see my analysis of the distribution of COVID-19 cases (blog post and paper). This approach leads to the following picture, showing the all-time fraction ${\small P(n)}$ of countries having gained a number ${\small n}$ of gold, silver, or bronze medals:
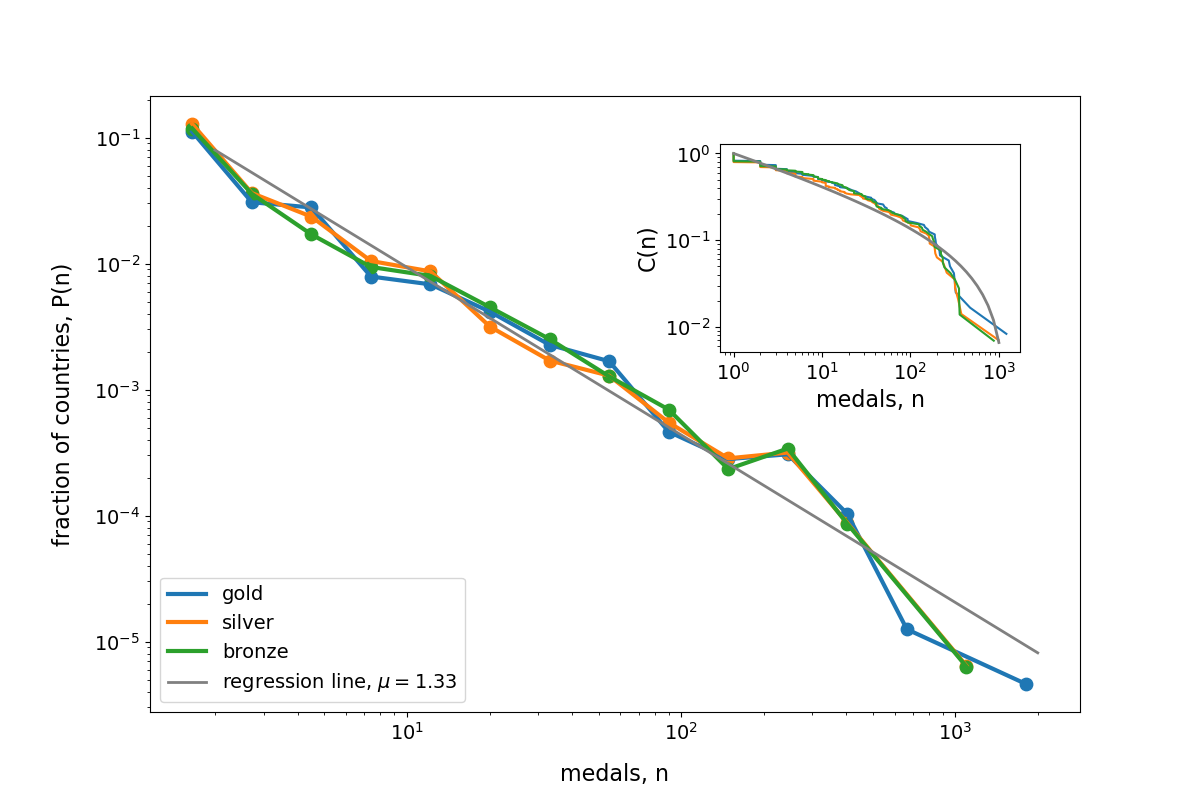
The figure shows that for all three medal types ${\small P(n)}$ closely follows a straight line on the double logarithmic plot. This reveals that the medal distribution is scale-free: the transition from the many countries with only a few medals to the few countries with many medals (the long tail of the distribution) continues with a smooth and constant decay over about three orders of magnitude.
Mathematically, this can be expressed as a power-law distribution
The critical exponent ${\small \mu}$ can be obtained in several ways, as detailed in this excellent review by Mark Newman. A simple straight-line fit through the log-log data yields a value of ${\small \mu \approx 1.33}$, which is plotted as the grey line in the figure above. Alternatively, the exponent can be estimated by a log-likelihood method, which yields a slightly larger exponent of ${\small \mu \approx 1.42}$. This exponent is still relatively small. Many empirical power-law distributions are characterized by exponents around ${\small \mu = 2}$. The small value of ${\small \mu = 1.3 \cdots 1.4}$, observed here, indicates that the distribution of Olympic medals has an extremely long tail for which, in the absence of an upper bound, the mean value diverges.
However, given that the total number of awarded medals is finite, the distribution might be more accurately described by a truncated power-law, that is, a power-law distribution with an upper bound ${\small n_{max}}$ for the number of medals a country can win (see the approach used in my COVID-19 analysis).
The importance of this upper bound becomes apparent when looking at the cumulative distribution function ${ \small C(n) =\int_n^\infty P(n’) dn’}$. For an unbounded power-law distribution ${ \small C(n)}$ should also follow a power-law ${\small C(n) \sim n^{1-\mu} }$. In contrast, a truncated power-law yields a downward-curving shape on a double-logarithmic plot, with ${\small C(n) = \left[ n^{(1-\mu)} - n_{max}^{(1-\mu)}\right] / \left[ 1-n_{max}^{(1-\mu)} \right]}$
This concept is illustrated in the inset of the figure above, which presents the cumulative medal distribution ${ \small C(n)}$ for gold, silver, and bronze medals, using ${\small \mu = 1.33}$ and ${\small n_{max} = 1200}$. The grey line represents the cumulative distribution of a truncated power-law, which fits the observed data well, confirming the presence of an upper limit in the medal distribution.
Explanation
There are many reasons that could explain the origin of the straight-line appearance of the medal distribution. Besides the traits of individual athletes (i.e., fitness, talent, experience, or sheer luck), there are country-level factors that influence the number of medals a country can win in an Olympic competition. Differences in countries with respect to population size or economic power, financial funding of sports, or gender equity also play a role, as does the number of times a country participated in different Olympic games. Therefore, it is no surprise that the disparities among countries in the world, which often can be expressed as a power-law, are reflected in the distribution of Olympic medals. For more insights into these issues, see the seminal study by Bernard and Busse.
Thus, we can align the distribution of Olympic medals with many other instances of power-law distributions found in social, technical, natural, and biological systems, such as the distribution of city sizes, income, word frequencies, social contacts, and earthquake magnitudes. In my research I found power-law distribution in various domains, including cargo shipping networks, the popularity of chess openings, and the number of COVID-19 cases per country.
Caveats
Please note that this is just a simple look at the data. A more serious investigation would be more involved.
First, it would require addressing the fact that national identities have not remained constant over the more than hundred years that the Olympic Games have been held. For instance, Germany has competed under five different designations, including as two separate teams of East and West Germany at several Games, and it was banned on three occasions (1920, 1924, and 1948). The situation is even more complicated with Russia, which has competed as the Russian Empire, the Soviet Union, the Unified Team, the Russian Federation, and various Post-Soviet states.
Next, the number of times a country has participated in the Games varies tremendously, including several political boycotts. Only France, Great Britain, and Switzerland have participated in all 54 Olympic Games. Addressing these variations in a statistical analysis is non-trivial. Should different national designations be treated as separate teams (as is done here), or should the medal counts for all designations be pooled together? Given these complications, the clean power-law scaling observed in the medal distribution is even more impressive.
Beyond this analysis, a comprehensive analysis would require, for instance,
comparing Summer and Winter Games, analyzing changes in the medal distribution over different years, and examining
differences between medal wins by males and females or by different sports.
Additionally, while I plotted the distribution of the total number of medals per country, it would be interesting to investigate the distribution of relative medals counts, that is, medals won divided by the population of a country or the number of times the country has participated in Olympic games.
Obviously there are many different distributions besides a power-law that can fit the Olympic medal data, and I do not claim that the medal distribution precisely follows a power law in a strict mathematical sense. Proofing this would require extensive statistical testing, and given the relatively short and noisy data set, it is likely that the distribution would fail such tests for a simple power-law. However, such detailed testing, often debated in the context of whether a data set adheres to a power-law or not, misses the crucial point: the distribution of Olympic medals per country exhibits all the characteristics of a power-law. This resemblance allows it to be discussed within the same context as many other social and natural distributions.
From an empirical point of view, properties of the medal distribution, such as the estimated critical slope, could serve as quantitative indicators or fingerprints for the complex socio-political processes underlying Olympic success, extending beyond the realm of sport alone.
The sinking role of Germany
As a side remark, I also studied the trend in the number of Olympic medals over the course of the years.
Such data is available, for example, from
olympedia.org.
In the following graph I plotted the gold-medal rank
(i.e., the position of a country in the medal table)
in Summer Olympic games
from 1992 to 2024 for four countries, the USA, China, Germany, and the Netherlands.
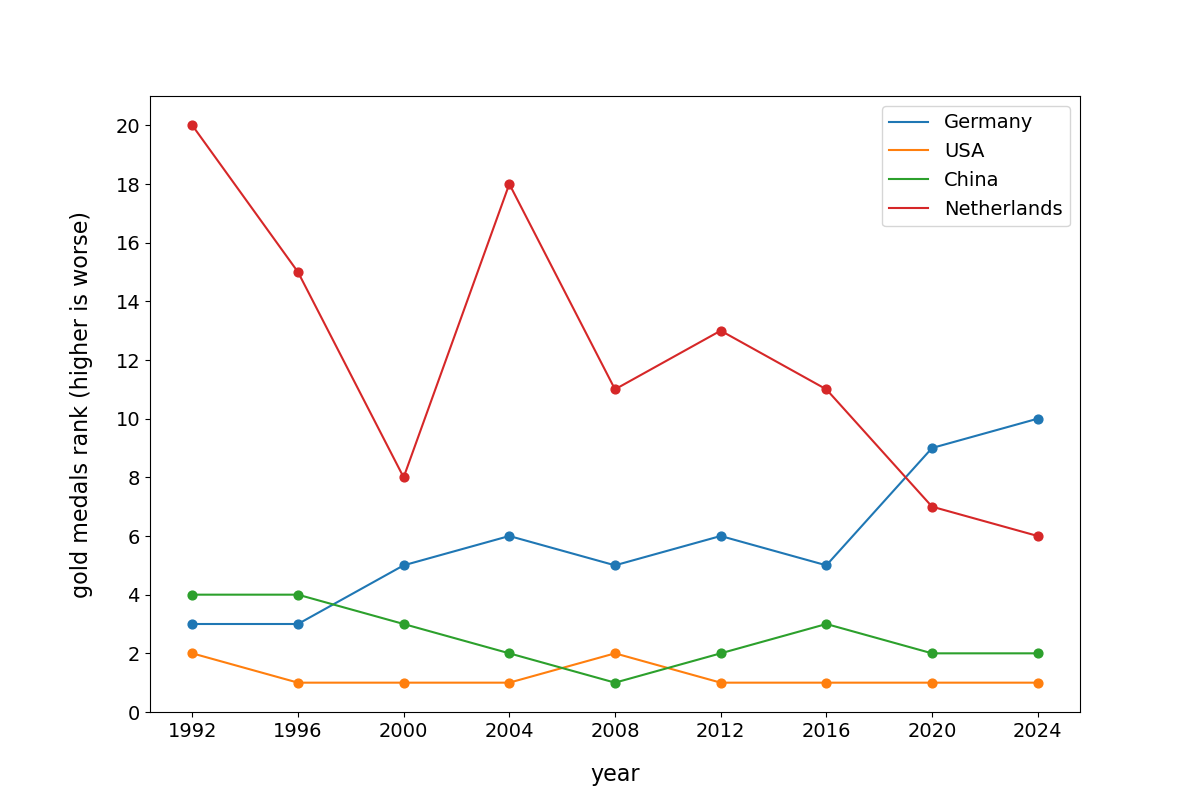 This shows some interesting trends.
While some countries, like the USA and China, remain relatively constant in their rank, the rank of Germany (blue line in the plot) is continuously increasing, meaning Germany is consistently doing worse in Summer Olympic games over the last 32 years.
This is interesting because other countries,
such as the Netherlands (red line), have managed to consistently improve there performance.
This shows some interesting trends.
While some countries, like the USA and China, remain relatively constant in their rank, the rank of Germany (blue line in the plot) is continuously increasing, meaning Germany is consistently doing worse in Summer Olympic games over the last 32 years.
This is interesting because other countries,
such as the Netherlands (red line), have managed to consistently improve there performance.
This topic is currently much debated in the German media and can be explained by a combination of many factors, such as the diminishing influence of combined East and West German athletes after the unification of Germany, or the varying levels of financial investment in professional sports by different countries. Despite these reasonable explanations it still saddens me a bit to see the declining trend for Germany's performance, as is too closely mirrors many other recent negative trends in this country.
Bernd Blasius
Professor for Mathematical Modelling
I am interested in the theoretical description of complex living systems at the interface of theoretical ecology and applied mathematics